Using AI to Monitor Crop Health: A Beginner’s Guide to NDVI and CNN in Agriculture
Introduction
Agriculture is under growing pressure to produce more food while adapting to climate change, water scarcity, drought, heat stress, and extreme weather. Because of this, farmers need smarter ways to monitor crop health and respond before problems become serious.
Modern agricultural technology now allows satellites and drones to detect crop stress before visible symptoms appear. This is made possible through two technologies working together: NDVI and CNNs.
NDVI, or Normalized Difference Vegetation Index, is a numerical measure of plant health based on how crops reflect different types of light. CNNs, or Convolutional Neural Networks, are AI models designed to recognize patterns in images. When combined, NDVI provides the crop health data, while CNNs interpret the patterns and identify possible problems.
Together, NDVI and CNN systems can scan large fields, detect early signs of stress, predict yields, support harvest planning, and help farmers make better decisions. This is especially relevant in countries like Thailand, where AI advisory services are being used to help farmers manage drought, heat stress, and crop productivity.
What is NDVI and Why Does It Matter for Crop Monitoring?
What exactly is NDVI?
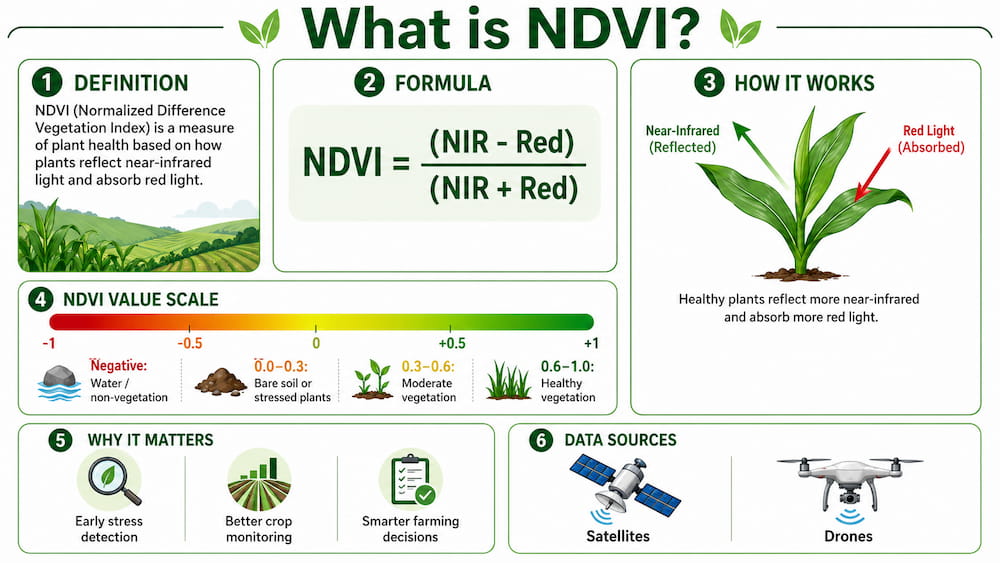
NDVI stands for Normalized Difference Vegetation Index. It measures plant health by comparing how much near-infrared light and red light plants reflect.
Healthy plants reflect a lot of near-infrared light because of their strong internal leaf structure. At the same time, they absorb red light for photosynthesis, which is the process plants use to convert sunlight into energy.
When plants become stressed because of drought, disease, pests, or nutrient problems, their internal leaf structure weakens. As a result, they reflect less near-infrared light and more red light. NDVI captures this change as a number.
The formula is:
NDVI = (Near-Infrared − Red) / (Near-Infrared + Red)
NDVI values range from -1 to +1. Higher values usually mean healthier vegetation.
|
NDVI Value Range |
What It Means |
Action Needed |
|
0.6 to 1.0 |
Healthy, vigorous crops |
Continue current management |
|
0.3 to 0.6 |
Sparse vegetation or early stress |
Investigate possible issues |
|
Below 0.3 |
Bare soil, dead vegetation, or severe stress |
Immediate attention required |
|
Negative values |
Water, urban areas, or non-vegetation |
Not applicable for crops |
How does NDVI detect crop problems early?
NDVI can detect crop stress before it becomes visible because plant leaves change internally before they show external symptoms.
Inside healthy leaves is a layer called the spongy mesophyll layer, where photosynthesis takes place. This layer contains air pockets that strongly reflect near-infrared light. When a plant becomes stressed, this structure becomes weaker, causing near-infrared reflectance to fall.
This drop in NDVI can happen days or weeks before farmers see yellowing, wilting, or poor growth. That early warning gives farmers more time to respond.
Where does NDVI data come from?
NDVI data usually comes from satellites or drones.
|
Data Source |
Resolution |
Coverage Area |
Best Use Case |
Cost |
|
Sentinel-2 satellite |
10 meters |
Global, every few days |
Regular monitoring of large fields |
Free |
|
Drones |
1–5 cm |
Specific fields on demand |
Detailed inspection of problem areas |
Equipment and operation cost |
|
Commercial satellites |
3–5 meters |
Frequent global coverage |
High-frequency monitoring |
Subscription-based |
Sentinel-2 is commonly used because it provides free satellite images with enough detail to monitor individual fields. Drones provide much sharper images but require equipment, planning, and trained operators.
How Does NDVI Connect to CNN for Automated Crop Diagnosis?
What is the role of CNN in crop monitoring?
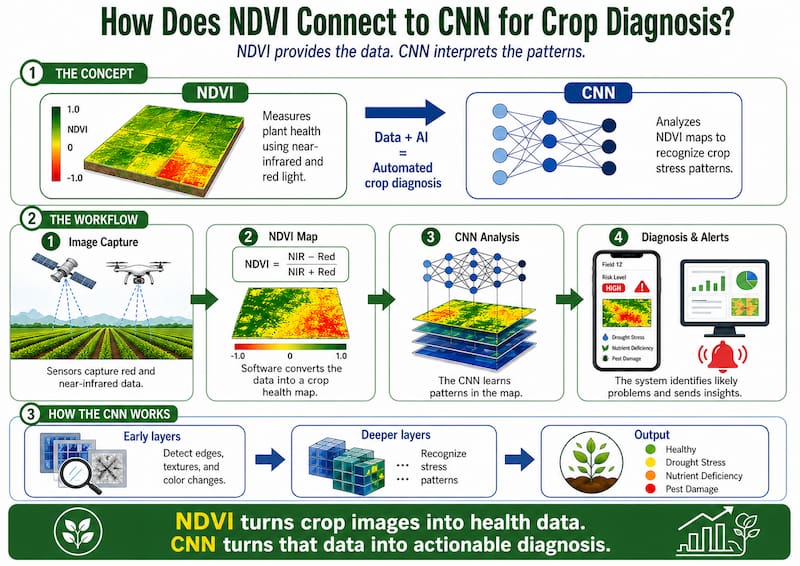
NDVI provides the data, while CNNs provide the interpretation.
A simple way to understand it is this:
NDVI is the diagnostic test. CNN is the expert reading the test result.
NDVI creates a crop health map, where each pixel represents a part of the field. CNNs then analyze the map to detect patterns linked to different crop problems.
For example, a CNN may learn that a smooth, gradual drop in NDVI is often linked to drought, while sudden patchy drops may suggest pest damage or disease.
What is a CNN?
A Convolutional Neural Network, or CNN, is a type of AI model designed to analyze images. It works by passing an image through several layers. Each layer learns different types of patterns.
|
CNN Layer Type |
What It Learns |
|
Early layers |
Edges, textures, color changes, simple shapes |
|
Middle layers |
Stressed patches, vegetation patterns, irregular areas |
|
Deep layers |
Drought stress, pest damage, nutrient deficiency, disease patterns |
This layered learning allows CNNs to detect patterns that may be too subtle for humans to notice. In many agricultural applications, CNN models using NDVI data can detect crop stress with accuracy above 90% for common problems.
The NDVI-CNN workflow
|
Step |
Process |
What Happens |
|
1 |
Image capture |
Satellites or drones capture crop images using multispectral cameras |
|
2 |
NDVI calculation |
Software calculates NDVI values for each pixel |
|
3 |
CNN analysis |
The AI model scans the NDVI map for stress patterns |
|
4 |
Alert generation |
The system sends alerts when stress is detected with high confidence |
This workflow allows large areas of farmland to be monitored quickly and consistently.
Complementary Vegetation Indices
NDVI is useful, but it does not always explain the exact cause of stress. That is why other vegetation indices are often used together with NDVI.
|
Index |
Full Name |
What It Measures |
Main Use |
|
NDWI |
Normalized Difference Water Index |
Water content in plants |
Detecting drought and irrigation needs |
|
H_VSI |
Healthy Vegetation Stress Index |
Vascular or internal water transport stress |
Identifying internal plant stress |
|
EVI |
Enhanced Vegetation Index |
Vegetation health with reduced atmospheric effects |
Dense canopy monitoring |
|
GNDVI |
Green NDVI |
Chlorophyll content |
Detecting nitrogen deficiency |
For example, low NDVI alone may suggest drought, nutrient deficiency, or pest damage. But if NDVI is low and NDWI is also low, drought becomes more likely.
Understanding the Spectral Bands Behind NDVI
What are spectral bands?
Spectral bands are specific ranges of light wavelengths that sensors can measure. Human eyes can see visible light, such as red, green, and blue. However, NDVI depends heavily on near-infrared light, which humans cannot see.
Special satellite or drone sensors are needed to capture this invisible light.
NDVI mainly uses:
|
Band |
Wavelength |
Purpose |
|---|---|---|
|
Red |
Around 665 nm |
Shows chlorophyll absorption |
|
Near-infrared |
Around 842 nm |
Shows vegetation structure and health |
Healthy plants absorb red light because chlorophyll uses it for photosynthesis. They also reflect near-infrared light strongly because of their healthy internal leaf structure.
When plants are stressed, chlorophyll production may decrease, and the leaf structure becomes weaker. This causes red reflectance to rise and near-infrared reflectance to fall, lowering the NDVI score.
Sentinel-2 bands used in crop monitoring
|
Band Number |
Wavelength |
Common Name |
What It Reveals |
|
Band 2 |
490 nm |
Blue |
Chlorophyll absorption and atmospheric correction |
|
Band 3 |
560 nm |
Green |
Healthy vegetation reflectance |
|
Band 4 |
665 nm |
Red |
Photosynthesis and chlorophyll activity |
|
Band 8 |
842 nm |
Near-infrared |
Vegetation health and leaf structure |
|
Band 11 |
1610 nm |
SWIR1 |
Leaf water and dry matter content |
|
Band 12 |
2190 nm |
SWIR2 |
Moisture stress and plant dryness |
SWIR, or short-wave infrared, is especially useful for detecting plant water content. This helps distinguish drought stress from other problems.
How to Preprocess NDVI Data for CNN Models
Before NDVI data is used in a CNN model, it must be cleaned and prepared. Raw satellite data may contain cloud shadows, atmospheric interference, sensor noise, or inconsistent lighting. If these issues are not corrected, the AI model may mistake poor image quality for crop stress.
Key preprocessing steps
|
Step |
Purpose |
Why It Matters |
|
Atmospheric correction |
Removes distortion caused by particles in the air |
Makes images comparable across dates and locations |
|
Smoothing |
Reduces random noise |
Prevents the CNN from reacting to false patterns |
|
Z-score normalization |
Standardizes data values |
Helps the model learn fairly from all features |
|
PCA |
Reduces unnecessary features |
Keeps the most important information and removes redundancy |
1. Atmospheric correction
Satellite images can be affected by haze, humidity, dust, and aerosols. Atmospheric correction removes these effects so that the reflectance values represent the actual crop surface more accurately.
Sentinel-2 Level-2A data already includes atmospheric correction, making it easier for beginners to use.
2. Smoothing
Even corrected images can contain random noise. A common method called Savitzky-Golay filtering smooths the data while preserving important crop health patterns.
3. Z-score normalization
Z-score normalization scales the data so the model does not give too much importance to features simply because they have larger numbers.
4. PCA
Principal Component Analysis, or PCA, reduces the number of features while keeping the most important patterns. This helps the CNN learn faster and avoid being overwhelmed by unnecessary data.
Which CNN Models Work Best for Crop Diagnosis?
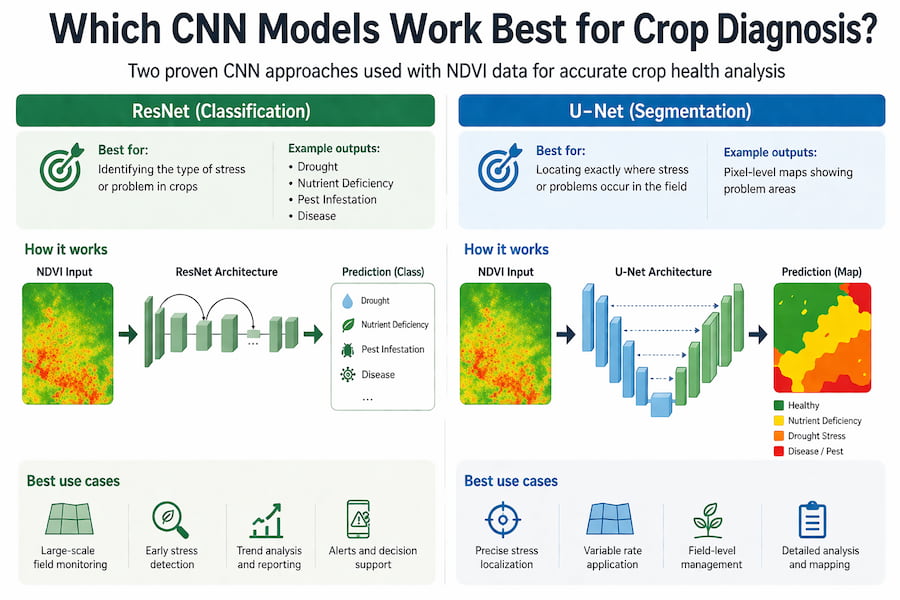
Two CNN architectures are especially useful in crop monitoring: ResNet and U-Net.
|
Feature |
ResNet |
U-Net |
|
Main use |
Classification |
Segmentation |
|
Best for |
Identifying what problem exists |
Mapping exactly where the problem is |
|
Output |
Category label |
Pixel-by-pixel map |
|
Strength |
Works well with transfer learning |
Excellent for boundary detection |
|
Example use |
“This field has drought stress” |
“This part of the field is stressed” |
ResNet for classification
ResNet, or Residual Network, is useful when the goal is to classify crop health. For example, it can identify whether a field is healthy, drought-stressed, nutrient-deficient, or affected by pests.
ResNet uses skip connections, which allow information to move across layers more easily. This helps the model learn complex patterns without losing important information.
U-Net for segmentation
U-Net is used when farmers need to know the exact location of the problem. Instead of only saying that a field has stress, U-Net can show which parts of the field are affected.
This is useful for targeted action, such as applying fertilizer or pesticide only where needed.
Transfer learning
Transfer learning allows a model that was already trained on millions of images to be adapted for crop monitoring. Instead of training a CNN from scratch, farmers or developers can start with a pretrained model such as ResNet-50, then fine-tune it using NDVI crop data.
A common process is:
- Load a pretrained ResNet-50 model.
- Replace the final classification layer with crop stress categories.
- Train the model using labeled NDVI images.
- Fine-tune carefully using a low learning rate.
- Test the model on data it has never seen before.
This saves time and reduces the amount of training data needed.
How NDVI-CNN Detects Specific Crop Problems
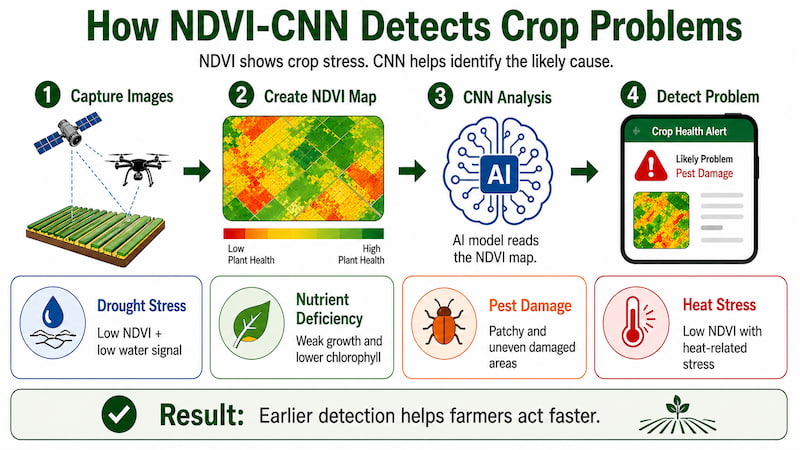
Different crop problems create different patterns in NDVI, NDWI, and SWIR data. CNN models learn these patterns and classify the likely stress type.
|
Stress Type |
NDVI Pattern |
Other Indicators |
Typical Accuracy |
|
Drought stress |
NDVI drops below 0.4 |
Low NDWI, water loss |
Around 93% |
|
Nitrogen deficiency |
Reduced NIR, increased red reflectance |
Lower chlorophyll |
Around 91% |
|
Pest damage |
Sudden, irregular NDVI drops |
Patchy distribution |
Varies |
|
Heat stress |
Low NDVI with SWIR signals |
High temperature effects |
Around 90% |
|
Disease |
Localized NDVI drops |
Often follows field patterns |
Varies |
Drought stress
Drought stress usually shows as both low NDVI and low NDWI. As water becomes limited, plants close their stomata to reduce water loss. This reduces photosynthesis and weakens the leaf structure, causing NDVI to fall.
Early detection allows farmers to irrigate before damage becomes irreversible.
Nutrient deficiency
Nitrogen deficiency affects chlorophyll production. Since chlorophyll absorbs red light, a lack of nitrogen causes plants to reflect more red light and show lower NDVI values.
CNN models can learn the difference between nitrogen deficiency and other problems by studying repeated examples.
Pest and disease damage
Pest damage often appears as irregular or patchy NDVI drops. Unlike drought, which may affect a field more evenly, pests and diseases often spread from specific points.
CNNs can recognize these uneven patterns and alert farmers before the problem spreads further.
Yield Prediction and Harvest Planning
NDVI-CNN systems can do more than detect problems. They can also help predict yield and identify better harvest timing.
Yield prediction
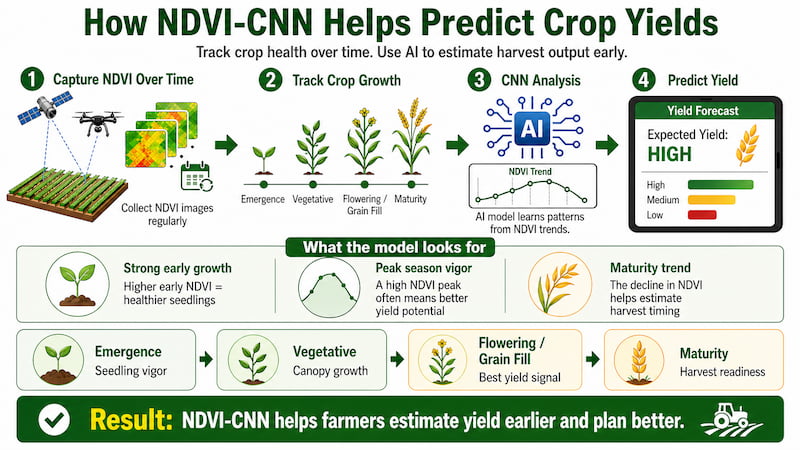
By tracking NDVI over the growing season, CNN models can learn patterns linked to final yield.
|
Growth Stage |
NDVI Measurement |
What It Predicts |
|
Emergence |
Early NDVI values |
Seedling strength |
|
Vegetative stage |
Rate of NDVI increase |
Canopy growth and plant health |
|
Flowering or grain fill |
Maximum NDVI and timing |
Yield potential |
|
Maturation |
NDVI decline rate |
Harvest readiness |
Higher or earlier NDVI peaks often suggest stronger crop growth and better yield potential. These patterns can be compared with historical yield records to forecast harvest outcomes weeks in advance.
Harvest timing
As crops mature, NDVI usually declines because leaves turn yellow and dry. SWIR data helps confirm whether leaf moisture is stable.
|
Metric |
What It Shows |
Harvest Signal |
|
NDVI decline |
Leaf yellowing and maturity |
Crop is moving toward harvest stage |
|
SWIR stability |
Moisture consistency |
Crop is reaching uniform maturity |
|
Rate of change |
Speed of maturation |
Helps avoid harvesting too early or too late |
Harvesting too early may reduce yield and quality. Harvesting too late increases the risk of weather damage, lodging, and crop losses.
Equipment and Software Needed for NDVI-CNN Systems
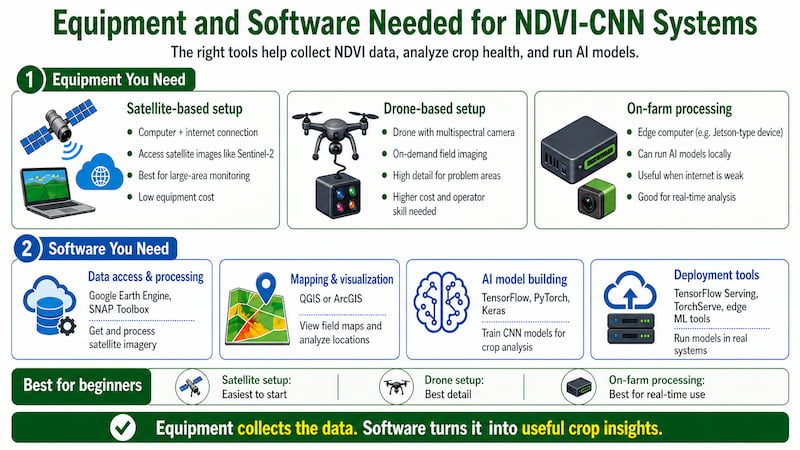
Hardware options
|
System Type |
Components |
Pros |
Cons |
|
Satellite-based |
Computer and internet connection |
Free data, wide coverage |
Lower resolution, fixed revisit schedule |
|
Drone-based |
Drone, multispectral camera, software |
High detail, on-demand images |
Higher cost and operator skill needed |
|
On-farm processing |
Edge computer, cameras |
Real-time analysis |
More complex setup |
Many users begin with satellite data through Google Earth Engine, which allows users to access and process large amounts of satellite imagery without owning specialized equipment.
Software tools
|
Category |
Examples |
Use |
|
Data access |
Google Earth Engine, SNAP Toolbox |
Satellite image processing |
|
Mapping |
QGIS, ArcGIS |
Spatial analysis and visualization |
|
Deep learning |
TensorFlow, PyTorch, Keras |
Building and training CNN models |
|
Deployment |
TensorFlow Serving, TorchServe, TensorFlow Lite |
Running models in real-world systems |
Implementation roadmap
|
Phase |
Duration |
Activity |
Outcome |
|
Phase 1 |
1–2 growing seasons |
Collect NDVI data and field labels |
Training dataset |
|
Phase 2 |
4–8 weeks |
Train or fine-tune CNN model |
Working model |
|
Phase 3 |
2–4 weeks |
Deploy into monitoring workflow |
Active system |
|
Phase 4 |
Ongoing |
Retrain with new data |
Better accuracy over time |
Common Mistakes to Avoid
|
Mistake |
What Happens |
Solution |
|
Data drift |
Model accuracy drops across seasons |
Retrain regularly with fresh data |
|
Overfitting |
Model performs well in training but poorly in real fields |
Use cross-validation and simpler models when needed |
|
Insufficient training data |
Model struggles with rare stress types |
Use data augmentation and shared datasets |
|
Weather artifacts |
Cloud shadows create false alerts |
Filter poor-quality images and use confidence thresholds |
Cross-validation
Cross-validation tests whether a model can perform well on data it has not seen before. In k-fold cross-validation, the dataset is split into several parts. The model trains on some parts and tests on the remaining part. This helps detect overfitting before deployment.
Data augmentation
Data augmentation creates more training examples by modifying existing images. Common techniques include rotating, flipping, adjusting brightness, or adding small amounts of noise. This helps the model become more flexible and reliable.
AI Advisory Services in Thailand
Thailand is a strong example of how NDVI-CNN technology can be adapted for local agriculture. Thai farms often face challenges such as drought, heat stress, monsoon flooding, pest outbreaks, and crop-specific issues in rice, sugarcane, cassava, and rubber.
Thai AI advisory services commonly offer:
|
Service |
Description |
Delivery |
|
Satellite monitoring |
Regular crop health reports using Sentinel-2 |
Weekly or bi-weekly reports |
|
Drone inspection |
High-resolution field checks |
On-demand field visits |
|
Custom CNN models |
Models trained on Thai crop varieties |
Rice, sugarcane, cassava, rubber |
|
Mobile alerts |
Real-time warnings |
LINE, SMS, or mobile apps |
|
Training workshops |
NDVI interpretation support |
Hands-on farmer training |
Thai-specific models often perform better than generic systems because they are trained on local crops, climate conditions, and stress patterns. For example, rice and sugarcane in tropical climates have different spectral signatures from wheat or maize grown in temperate regions.
Local language support also matters. Thai-language alerts and mobile-first delivery make the technology easier for farmers and field operators to use.
Conclusion
NDVI-CNN technology makes crop monitoring faster, smarter, and more proactive. By using satellite or drone images, NDVI can detect early changes in plant health before visible symptoms appear, while CNN models interpret these patterns to identify possible issues such as drought, nutrient deficiency, pests, disease, or heat stress.
This helps farmers make better decisions about irrigation, fertilizer use, pest control, and harvest timing. Instead of reacting only after damage is visible, farmers can take action earlier to protect yields and reduce waste.
For countries like Thailand, localized AI systems are especially valuable because they can be trained on local crops, climate conditions, and farming challenges. As the technology becomes more accessible, NDVI and CNNs will play an important role in supporting more efficient, sustainable, and resilient agriculture.